Generate 2D k-mesh
POSCAR is needed to to get the lattice information. the following command generates a k-mesh (-0.2 <= x <= 0.2 and -0.2 <= y <= 0.2) on the xy plan and around the \(\Gamma\) point with 21 points along each dimension.
1 2 3 | import mcu
mymcu = mcu.POSCAR()
mymcu.get_2D_kmesh(origin=[0,0,0], krange=[0.2,0.2], plane='xy', npoint=[21,21])
|
You should get the KPOINTS file generated. This is not done yet. Copy the k-mesh block in IBZKPT file to the KPOINTS file and do a simple math to figure out how many k-points in total. This new KPOINTS file should be ready for band structure calculation step.
Parameters
- originlist
Default: [0,0,0] or \(\Gamma\) point
Fractional coordinates of the origin of the mesh
- krangelist
Default: [0.1,0.1]
The first indicates -0.2 <= x <= 0.2, similarly for the second dimension.
- planestr
Default: ‘xy’
Options: ‘xy’, ‘xz’, ‘yz’
- npointlist
Default: [11,11]
Number of k-points along each dimension
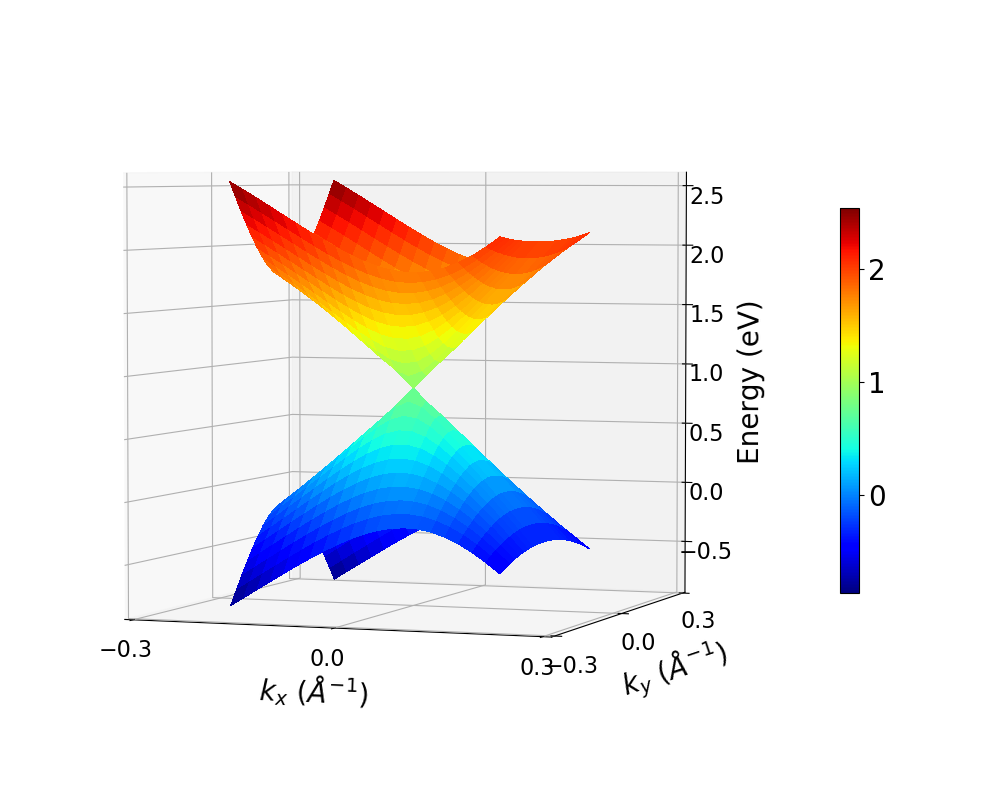
Plot 2D band structure
2D band structure can be generated by following this procedure
Run a conventional SCF calculation to get WAVECAR
Generate KPOINTS file for a 2D k-mesh using mcu
Run band structure calculation using the new KPOINTS file
After finishing the calculation, you should be able to plot it simly by:
1 2 3 | import mcu
mymcu = mcu.VASP()
mymcu.plot_band2D()
|
You can run the following example in the /mcu/example/Graphene_2D directory. You should get:
All parameters and their defaults of plot_band function are given below. Most of the parameters are passed to matplotlib functions. So more information can be found in matplotlib docs.
Parameters
- efermifloat
Default: fermi level from vasprun.xml or OUTCAR
User can shift the Fermi level to a value
- spinint
Default: 0
If ISPIN = 1: spin = 0
If ISPIN = 2: spin = 0 (Up spin) or 1 (Down spin)
- bandlist
Default: VBM and CBM
Which bands to plot
- cmapstr
Default: ‘bwr’
Colormap used in style = 3. Other colormap type can be found here
- savebool
Default: False
True to save to an image
- figsizetuple or list
Default: De(6,6)
Size of image in inch
- fignamestr
Default: ‘BAND2D’
Name of the image
- xlimlist or tuple
Default: from k-mesh
Plotting range for 1st momentum (k). Unit \(Angstrom^{-1}\)
- ylimlist or tuple
Default: from k-mesh
Plotting range for 2nd momentum (k). Unit \(Angstrom^{-1}\)
- zlimlist or tuple
Default: from band values
Plotting range for energy (eV)
- fontsizeint
Default: 18
Font size
- dpiint
Default: 600
Resolution of the image
- formatstr
Default: ‘png’
Extension of the image
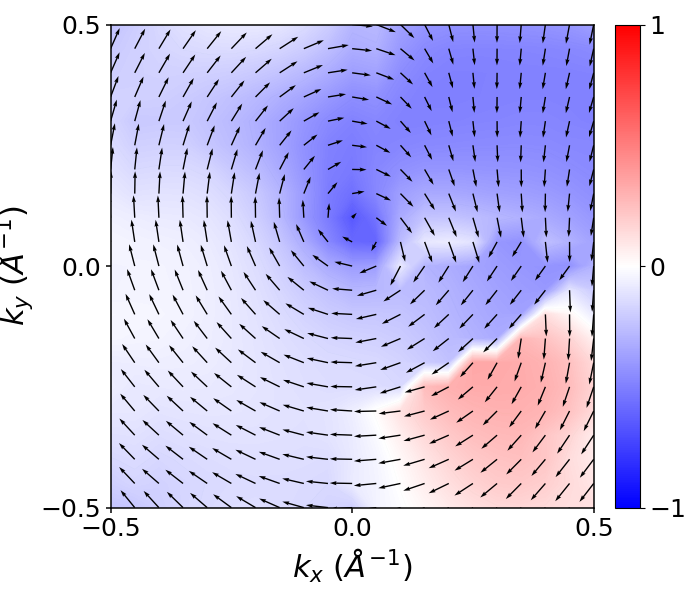
Plot spin texture
Spin texture can be generated by following the same procedure as 2D band structure except that one should add the key word LSORBIT = .TRUE. for SOC in INCAR file. After finishing the calculation, you should be able to plot it simly by:
1 2 3 | import mcu
mymcu = mcu.VASP()
mymcu.plot_spin(band=2)
|
You can run the following example in the /mcu/example/MoS2_spintexture directory. You should get:
All parameters and their defaults of plot_spin function are given below. Most of the parameters are passed to matplotlib functions. So more information can be found in matplotlib docs.
Parameters
- styleint
Default: 1
Style = 1: the colormap for the third dimension is in the background
Style = 2: the colormap for the third dimension is in the arrows themselves
- lmstr or list of str
Default: all the atoms and lm
Use can specify an orbital or a list of them, e.g. ‘Ni:s’ or [‘Ni:s’,’C:pz’]
- bandint
Default: VBM
spin texture is plot for this band
- cmapstr
Default: ‘bwr’
Colormap used in style = 3. Other colormap type can be found here
- colorstr
Default: ‘k’
The color of the arrows used in the style = 1. No effect if style = 2
- scaleint
Default: 15
Used to adjust the length of the arrow. The smaller the scale, the longer the arrows.
- scale_unitsstr
Default: None
Used together with scale to play with the arrow’s length. Check here for more details
- savebool
Default: False
True to save to an image
- figsizetuple or list
Default: De(6,6)
Size of image in inch
- fignamestr
Default: ‘spin_texture’
Name of the image
- xlimlist or tuple
Default: from k-mesh
Plotting range for 1st momentum (k). Unit \(Angstrom^{-1}\)
- ylimlist or tuple
Default: from k-mesh
Plotting range for 2nd momentum (k). Unit \(Angstrom^{-1}\)
- fontsizeint
Default: 18
Font size
- dpiint
Default: 600
Resolution of the image
- formatstr
Default: ‘png’
Extension of the image